Introduction
Debugging Docker containers is an essential skill for every developer and DevOps engineer. When containers misbehave, crash unexpectedly, or exhibit performance issues, you need powerful tools to diagnose and resolve problems quickly. Unlike traditional applications running directly on your host system, containerized applications require specialized debugging techniques.
In this comprehensive two-part series, you'll master Docker's most important debugging commands and techniques. This first part focuses on three fundamental debugging tools that form the foundation of container troubleshooting.
🎯 What You'll Learn in Part 1:
- View and analyze container logs with
docker logs(real-time, timestamped, filtered) - Execute commands inside running containers with
docker exec - Install debugging tools within containers
- Inspect detailed container configuration with
docker inspect - Extract specific container information using formatting
- Practical debugging workflows for common issues
Prerequisites:
- Docker installed on your system
- Basic understanding of Docker containers
- Familiarity with Linux command line
Lab Setup: Creating a Debug Practice Environment
Before we dive into debugging techniques, let's create a practical test application that we'll use throughout this tutorial. This application includes logging at different levels and various endpoints to simulate real-world scenarios.
Creating the Test Application
First, create a dedicated directory for our debugging practice:
mkdir debug-practice
cd debug-practice
What this does:
mkdir debug-practice: Creates a new directory named "debug-practice"cd debug-practice: Changes into the newly created directory
Now, create a simple Python HTTP server application with built-in logging:
cat > app.py << 'EOF'
import time
import sys
import logging
from http.server import HTTPServer, BaseHTTPRequestHandler

# Configure logging
logging.basicConfig(level=logging.INFO, format='%(asctime)s - %(levelname)s - %(message)s')
logger = logging.getLogger(__name__)

class SimpleHandler(BaseHTTPRequestHandler):
    def do_GET(self):
        logger.info(f"Received GET request for {self.path}")

        if self.path == '/':
            self.send_response(200)
            self.send_header('Content-type', 'text/html')
            self.end_headers()
            self.wfile.write(b'<h1>Debug Lab Application</h1>')
        elif self.path == '/error':
            logger.error("Intentional error endpoint accessed")
            self.send_response(500)
            self.end_headers()
            self.wfile.write(b'Internal Server Error')
        elif self.path == '/slow':
            logger.warning("Slow endpoint accessed - simulating delay")
            time.sleep(5)
            self.send_response(200)
            self.end_headers()
            self.wfile.write(b'Slow response completed')
        else:
            logger.warning(f"404 - Path not found: {self.path}")
            self.send_response(404)
            self.end_headers()
            self.wfile.write(b'Not Found')

if __name__ == '__main__':
    server = HTTPServer(('0.0.0.0', 8080), SimpleHandler)
    logger.info("Starting server on port 8080")
    try:
        server.serve_forever()
    except KeyboardInterrupt:
        logger.info("Server stopped")
        server.server_close()
EOF
Application Purpose: This Python application creates a simple HTTP server that demonstrates various logging scenarios:
- Root endpoint (/): Returns a success message
- /error endpoint: Simulates an error condition and logs an ERROR message
- /slow endpoint: Simulates a slow response with a 5-second delay
- Other paths: Returns 404 with a WARNING log
The application uses Python's logging module to generate INFO, WARNING, and ERROR level logs, making it perfect for practicing log analysis.
Creating the Dockerfile
Create a Dockerfile to containerize our application:
cat > Dockerfile << 'EOF'
FROM python:3.9-slim

WORKDIR /app

COPY app.py .

EXPOSE 8080

CMD [ "python", "app.py" ]
EOF
Dockerfile Explanation:
| Instruction | Purpose |
|---|---|
FROM python:3.9-slim | Uses minimal Python 3.9 base image (~130MB) |
WORKDIR /app | Sets /app as the working directory inside container |
COPY app.py . | Copies app.py from host to container's /app directory |
EXPOSE 8080 | Documents that container listens on port 8080 |
CMD ["python", "app.py"] | Default command to run when container starts |
Building and Running the Container
Build the Docker image:
docker build -t debug-app .
Command Breakdown:
docker build: Command to build a Docker image-t debug-app: Tags the image with the name "debug-app".: Build context (current directory)
Output:
[+] Building 17.7s (9/9) FINISHED                                           docker:default
 => [internal] load build definition from Dockerfile                                  0.1s
 => => transferring dockerfile: 186B                                                  0.0s
 => [internal] load metadata for docker.io/library/python:3.9-slim                   3.6s
 => [1/3] FROM docker.io/library/python:3.9-slim@sha256:5af360dcfbbd...             13.1s
 => => resolve docker.io/library/python:3.9-slim@sha256:5af360dcfbbd...              0.1s
 => => extracting sha256:8c7716127147648c1751940b9709b6325f2256290d320166...        3.8s
 => [2/3] WORKDIR /app                                                                0.6s
 => [3/3] COPY app.py .                                                               0.1s
 => exporting to image                                                                0.1s
 => => writing image sha256:d47ca8df32695639872858b50edd1c35b9e2a7f24390...         0.0s
 => => naming to docker.io/library/debug-app                                         0.0s
Build Process Explanation:
- Docker loads the Dockerfile instructions
- Pulls the Python 3.9-slim base image (if not cached)
- Creates working directory /app
- Copies app.py into the image
- Saves the final image with tag "debug-app"
Verify the image was created:
docker images debug-app
Output:
REPOSITORY   TAG       IMAGE ID       CREATED          SIZE
debug-app    latest    d47ca8df3269   41 seconds ago   130MB
Now run the container:
docker run -d --name debug-container -p 8080:8080 debug-app
Command Breakdown:
docker run: Creates and starts a new container-d: Runs container in detached mode (background)--name debug-container: Names the container "debug-container"-p 8080:8080: Maps host port 8080 to container port 8080debug-app: Image to use
Output:
7629e1afa1f9b7703d5bdc85a99f251f95ab51382fc644a4ab21532101c09f4a
The long hexadecimal string is the full container ID. Your container is now running!
Docker Logs: Viewing Container Output
The docker logs command is your first line of defense when debugging containers. It retrieves logs from a running or stopped container, showing everything written to STDOUT and STDERR.
Basic Docker Logs
View all logs from the beginning:
docker logs debug-container
Output:
2025-10-15 10:25:36,504 - INFO - Starting server on port 8080
What You See:
- Timestamp: When the log entry was created (container's timezone)
- Log Level: INFO, WARNING, or ERROR
- Message: The actual log content
At this point, the container has just started, so we only see the startup message.
Real-Time Log Monitoring with -f
The -f (follow) flag streams logs in real-time, similar to tail -f:
docker logs -f debug-container
Purpose: Continuously displays new log entries as they occur, perfect for monitoring active applications.
In a separate terminal, generate some HTTP requests:
curl http://localhost:8080/
curl http://localhost:8080/error
curl http://localhost:8080/nonexistent
Real-Time Log Output:
2025-10-15 10:25:36,504 - INFO - Starting server on port 8080
2025-10-15 10:27:18,661 - INFO - Received GET request for /
172.17.0.1 - - [15/Oct/2025 10:27:18] "GET / HTTP/1.1" 200 -
2025-10-15 10:27:37,417 - INFO - Received GET request for /error
2025-10-15 10:27:37,417 - ERROR - Intentional error endpoint accessed
172.17.0.1 - - [15/Oct/2025 10:27:37] "GET /error HTTP/1.1" 500 -
2025-10-15 10:27:52,709 - INFO - Received GET request for /nonexistent
2025-10-15 10:27:52,709 - WARNING - 404 - Path not found: /nonexistent
172.17.0.1 - - [15/Oct/2025 10:27:52] "GET /nonexistent HTTP/1.1" 404 -
Log Analysis:
- 172.17.0.1: Docker bridge network gateway (the host making requests)
- 200: Successful request
- 500: Internal server error
- 404: Not found error
Press Ctrl+C to stop following the logs.
Logs with Timestamps: -t Flag
Add Docker timestamps to show when logs were captured:
docker logs -t debug-container
Output:
2025-10-15T10:25:36.505210982Z 2025-10-15 10:25:36,504 - INFO - Starting server on port 8080
2025-10-15T10:27:18.663275284Z 2025-10-15 10:27:18,661 - INFO - Received GET request for /
2025-10-15T10:27:18.664176385Z 172.17.0.1 - - [15/Oct/2025 10:27:18] "GET / HTTP/1.1" 200 -
2025-10-15T10:27:37.419906327Z 2025-10-15 10:27:37,417 - INFO - Received GET request for /error
2025-10-15T10:27:37.419954775Z 2025-10-15 10:27:37,417 - ERROR - Intentional error endpoint accessed
Understanding Dual Timestamps:
- First timestamp (Docker's):
2025-10-15T10:25:36.505210982Z- When Docker captured the log (UTC with nanosecond precision) - Second timestamp (Application's):
2025-10-15 10:25:36,504- When the application generated the log
The -t flag is useful for correlating container logs with host system events.
Limiting Log Output: --tail Flag
When containers have been running for a while, logs can be overwhelming. Use --tail to view only the most recent entries:
docker logs --tail 10 debug-container
Purpose: Shows only the last 10 log lines
Output:
172.17.0.1 - - [15/Oct/2025 10:27:18] "GET / HTTP/1.1" 200 -
2025-10-15 10:27:37,417 - INFO - Received GET request for /error
2025-10-15 10:27:37,417 - ERROR - Intentional error endpoint accessed
172.17.0.1 - - [15/Oct/2025 10:27:37] "GET /error HTTP/1.1" 500 -
2025-10-15 10:27:52,709 - INFO - Received GET request for /nonexistent
2025-10-15 10:27:52,709 - WARNING - 404 - Path not found: /nonexistent
172.17.0.1 - - [15/Oct/2025 10:27:52] "GET /nonexistent HTTP/1.1" 404 -
2025-10-15 10:28:23,668 - INFO - Received GET request for /nonexistent/slow
2025-10-15 10:28:23,668 - WARNING - 404 - Path not found: /nonexistent/slow
172.17.0.1 - - [15/Oct/2025 10:28:23] "GET /nonexistent/slow HTTP/1.1" 404 -
Pro Tip: Combine --tail with -f for real-time monitoring of recent logs:
docker logs --tail 50 -f debug-container
This shows the last 50 lines, then continues streaming new logs.
Time-Based Log Filtering: --since and --until
Filter logs by time range to focus on specific periods:
Using --since with Relative Time
Show logs from the last 5 minutes:
docker logs --since 5m debug-container
Generate a new request first:
curl http://localhost:8080
Then check recent logs:
docker logs --since 5m debug-container
Output:
2025-10-15 10:47:14,824 - INFO - Received GET request for /
172.17.0.1 - - [15/Oct/2025 10:47:14] "GET / HTTP/1.1" 200 -
Common --since Formats:
| Format | Example | Meaning |
|---|---|---|
| Seconds | --since 30s | Last 30 seconds |
| Minutes | --since 15m | Last 15 minutes |
| Hours | --since 2h | Last 2 hours |
| Timestamp | --since "2025-10-15T15:30:00" | Since specific date/time |
Using --since with Absolute Timestamp
docker logs --since "2025-10-15T15:30:00" debug-container
Important: Timestamp format must be RFC3339: YYYY-MM-DDTHH:MM:SS
Common Mistake:
# WRONG - Month and day reversed
docker logs --since "2025-15-10T15:30:00" debug-container
# Error: invalid value for "since": parsing time "2025-15-10T15:30:00": month out of range

# CORRECT
docker logs --since "2025-10-15T15:30:00" debug-container
Combining --since and --until
View logs within a specific time window:
docker logs --since "2025-10-15T15:30:00" --until "2025-10-15T15:47:00" debug-container
Use Case: Investigating an incident that occurred during a specific timeframe.
Filtering Logs with grep
Combine docker logs with grep to search for specific patterns:
Finding Errors
docker logs debug-container 2>&1 | grep -i error
Command Breakdown:
2>&1: Redirects STDERR to STDOUT (captures both output streams)grep -i error: Searches case-insensitively for "error"
Output:
2025-10-15 10:27:37,417 - INFO - Received GET request for /error
2025-10-15 10:27:37,417 - ERROR - Intentional error endpoint accessed
172.17.0.1 - - [15/Oct/2025 10:27:37] "GET /error HTTP/1.1" 500 -
Finding HTTP Status Codes
Search for HTTP errors (4xx and 5xx):
docker logs debug-container 2>&1 | grep "404\|500"
Output:
172.17.0.1 - - [15/Oct/2025 10:27:37] "GET /error HTTP/1.1" 500 -
2025-10-15 10:27:52,709 - WARNING - 404 - Path not found: /nonexistent
172.17.0.1 - - [15/Oct/2025 10:27:52] "GET /nonexistent HTTP/1.1" 404 -
2025-10-15 10:28:23,668 - WARNING - 404 - Path not found: /nonexistent/slow
172.17.0.1 - - [15/Oct/2025 10:28:23] "GET /nonexistent/slow HTTP/1.1" 404 -
Pattern Explanation:
"404\|500": Matches either "404" OR "500"\|: Escape character for OR operator in basic grep
Docker Exec: Interactive Container Debugging
While docker logs shows you what happened, docker exec lets you get inside the container to investigate and fix issues in real-time. This is like SSH-ing into a remote server, but for containers.
Basic Command Execution
Execute a command inside a running container:
docker exec debug-container python --version
Output:
Python 3.9.24
What This Does:
- Runs the
python --versioncommand inside the container - Displays output on your host terminal
- Container continues running normally
Interactive Shell Access: -it Flags
Enter the container with an interactive bash shell:
docker exec -it debug-container bash
Flag Breakdown:
-i(interactive): Keeps STDIN open, allowing you to type commands-t(tty): Allocates a pseudo-TTY (terminal), enabling interactive programs
You'll see a prompt like:
root@7629e1afa1f9:/app#
Prompt Breakdown:
root: Current user inside container7629e1afa1f9: Container ID (short form)/app: Current directory
Now you're inside the container! Let's explore:
pwd
Output:
/app
Check the current directory contents:
ls -al
Output:
total 4
drwxr-xr-x. 1 root root   20 Oct 15 10:23 .
drwxr-xr-x. 1 root root   17 Oct 15 10:25 ..
-rw-r--r--. 1 root root 1543 Oct 15 10:20 app.py
Installing Debugging Tools Inside Containers
Minimal base images (like python:3.9-slim) don't include many debugging tools to keep image sizes small. You'll often need to install them:
Installing procps (ps, top, free)
Try to view processes:
ps aux
Error:
bash: ps: command not found
Install procps package:
apt-get update
apt-get install -y procps
Installation Output (partial):
Reading package lists... Done
Building dependency tree... Done
The following NEW packages will be installed:
  libproc2-0 linux-sysctl-defaults procps psmisc
Fetched 1220 kB in 4s (2524 kB/s)
Setting up procps (2:4.0.4-9) ...
Now try again:
ps aux
Output:
USER         PID %CPU %MEM    VSZ   RSS TTY      STAT START   TIME COMMAND
root           1  0.0  0.2  27636 19576 ?        Ss   10:25   0:01 python app.py
root           7  0.0  0.0   4764  3964 pts/0    Ss   11:29   0:00 bash
root         115  0.0  0.0   6792  4084 pts/0    R+   11:32   0:00 ps aux
Process Breakdown:
| PID | Command | Purpose |
|---|---|---|
| 1 | python app.py | Main application (PID 1 is always the container's main process) |
| 7 | bash | Our interactive shell created by docker exec |
| 115 | ps aux | The ps command we just ran |
Why is PID 1 Important?
- If PID 1 exits, the container stops
- In this case, if
python app.pycrashes, the container will die - This is why containers should have proper process management
Installing Network Tools (iproute2)
Check network configuration:
ip addr show
Error:
bash: ip: command not found
Install network tools:
apt-get install -y iproute2
Now check the IP address:
ip addr show
Output:
1: lo: <LOOPBACK,UP,LOWER_UP> mtu 65536 qdisc noqueue state UNKNOWN group default qlen 1000
    link/loopback 00:00:00:00:00:00 brd 00:00:00:00:00:00
    inet 127.0.0.1/8 scope host lo
       valid_lft forever preferred_lft forever
2: eth0@if5: <BROADCAST,MULTICAST,UP,LOWER_UP> mtu 1500 qdisc noqueue state UP group default
    link/ether c6:70:24:71:68:30 brd ff:ff:ff:ff:ff:ff link-netnsid 0
    inet 172.17.0.2/16 brd 172.17.255.255 scope global eth0
       valid_lft forever preferred_lft forever
Network Interface Breakdown:
| Interface | IP Address | Purpose |
|---|---|---|
lo (loopback) | 127.0.0.1 | Local loopback interface (same in all containers) |
eth0 | 172.17.0.2/16 | Container's network interface on Docker bridge |
172.17.0.2 is the container's IP address on Docker's default bridge network (172.17.0.0/16 subnet).
Checking Environment Variables
View environment variables to understand the container's configuration:
env | grep -E "(PATH|PYTHON|HOME)"
Output:
PYTHON_SHA256=668391afabd5083faafa4543753d190f82f33ce6ba22d6e9ac728b43644b278a
PYTHON_VERSION=3.9.24
HOME=/root
PATH=/usr/local/bin:/usr/local/sbin:/usr/local/bin:/usr/sbin:/usr/bin:/sbin:/bin
Variable Explanation:
PYTHON_VERSION: Python version in the image (set by base image)HOME: Home directory for root userPATH: Command search path (includes Python directories)
Exit the interactive shell:
exit
You'll return to your host terminal.
Running Commands from Host
You can also run commands without entering an interactive shell:
docker exec debug-container cat app.py
Output: (Shows the complete app.py file content)
Check disk usage:
docker exec debug-container df -h
Output:
Filesystem                Size  Used Avail Use% Mounted on
overlay                    62G   12G   50G  19% /
tmpfs                      64M     0   64M   0% /dev
shm                        64M     0   64M   0% /dev/shm
/dev/mapper/cs_vbox-root   62G   12G   50G  19% /etc/hosts
Filesystem Explanation:
- overlay: Container's filesystem (uses overlay2 storage driver)
- tmpfs: Temporary filesystem in memory
- shm: Shared memory
Check memory usage:
docker exec debug-container free -h
Output:
               total        used        free      shared  buff/cache   available
Mem:           7.5Gi       3.5Gi       1.9Gi       211Mi       2.6Gi       4.0Gi
Swap:          7.9Gi          0B       7.9Gi
Important Note: This shows the host's memory, not a container-specific limit (unless you set memory limits with --memory flag).
Installing Additional Debugging Tools
Install a comprehensive debugging toolkit:
docker exec -it debug-container bash
apt-get update
apt-get install -y curl wget htop strace
Tool Purposes:
| Tool | Purpose | Common Use |
|---|---|---|
curl | HTTP client for testing APIs | Test endpoints from inside container |
wget | Download files | Fetch external resources |
htop | Interactive process viewer | Monitor CPU, memory in real-time |
strace | Trace system calls | Debug application behavior at system level |
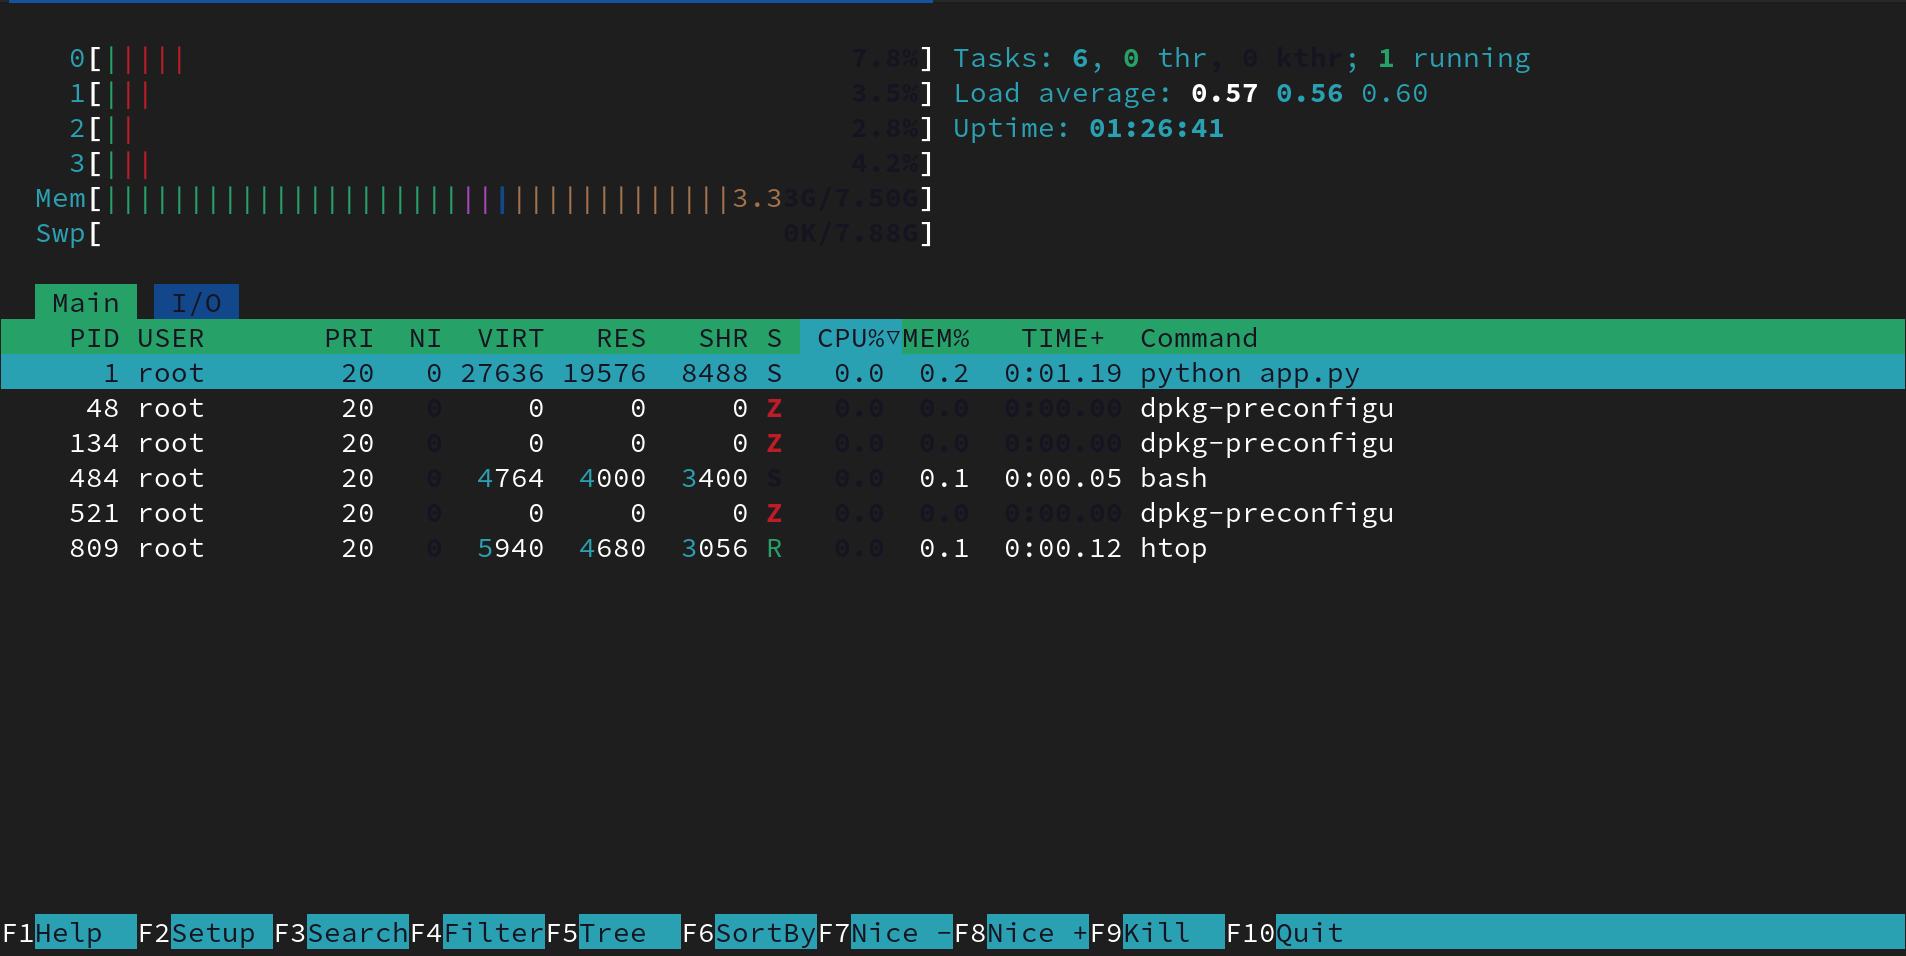
Test htop:
htop
You'll see an interactive process monitor. Here's a screenshot of htop running inside the container:
Press q to exit htop.
Test the application from inside the container:
curl http://localhost:8080
Output:
<h1>Debug Lab Application</h1>
Exit the shell:
exit
Docker Inspect: Deep Container Analysis
The docker inspect command provides comprehensive JSON-formatted information about Docker objects (containers, images, networks, volumes). It's invaluable for understanding container configuration and troubleshooting network or resource issues.
Basic Container Inspection
View complete container details:
docker inspect debug-container
Output: (Partial - the full output is very long)
[
    {
        "Id": "7629e1afa1f9b7703d5bdc85a99f251f95ab51382fc644a4ab21532101c09f4a",
        "Created": "2025-10-15T10:25:35.190673403Z",
        "Path": "python",
        "Args": [
            "app.py"
        ],
        "State": {
            "Status": "running",
            "Running": true,
            "Paused": false,
            "Restarting": false,
            "OOMKilled": false,
            "Dead": false,
            "Pid": 5634,
            "ExitCode": 0,
            "Error": "",
            "StartedAt": "2025-10-15T10:25:35.355155179Z",
            "FinishedAt": "0001-01-01T00:00:00Z"
        },
        "Image": "sha256:d47ca8df32695639872858b50edd1c35b9e2a7f2439074002e4786d6409f1218",
        ...
    }
]
Key Sections Explained:
| Section | Information |
|---|---|
Id | Full container ID (64 characters) |
Created | When container was created |
Path/Args | Command that runs in the container |
State | Current status, PID, exit code, etc. |
NetworkSettings | IP address, ports, network configuration |
Mounts | Volume mounts and bind mounts |
Config | Environment variables, exposed ports, labels |
Filtering Inspect Output with grep
The full JSON output can be overwhelming. Use grep to focus on specific sections:
Network Settings
docker inspect debug-container | grep -A 20 "NetworkSettings"
Output:
        "NetworkSettings": {
            "Bridge": "",
            "SandboxID": "7b4b2f7b3b2419c379fbe69f568a4c7d46e3f5ab23ea16c6eeb6d00e21d56fad",
            "SandboxKey": "/var/run/docker/netns/7b4b2f7b3b24",
            "Ports": {
                "8080/tcp": [
                    {
                        "HostIp": "0.0.0.0",
                        "HostPort": "8080"
                    },
                    {
                        "HostIp": "::",
                        "HostPort": "8080"
                    }
                ]
            },
            "HairpinMode": false,
            "LinkLocalIPv6Address": "",
            "LinkLocalIPv6PrefixLen": 0,
            "SecondaryIPAddresses": null,
            "SecondaryIPv6Addresses": null,
Understanding Port Mapping:
- "8080/tcp": Container port
- "HostIp": "0.0.0.0": Listening on all host interfaces (IPv4)
- "HostIp": "::": Listening on all host interfaces (IPv6)
- "HostPort": "8080": Host port mapped to container port
Using Format Strings: -f Flag
The -f flag lets you extract specific fields using Go templates, providing clean, script-friendly output:
Extract Container IP Address
docker inspect -f '{{range .NetworkSettings.Networks}}{{.IPAddress}}{{end}}' debug-container
Output:
172.17.0.2
Template Breakdown:
{{range .NetworkSettings.Networks}}: Iterate through all networks{{.IPAddress}}: Extract the IP address field{{end}}: End the range loop
Extract Network ID
docker inspect -f '{{range .NetworkSettings.Networks}}{{.NetworkID}}{{end}}' debug-container
Output:
28640f1f1918c84d789279470a428bd9933435a17f0fb51ce0661ff83ac9f10d
Extract Multiple Fields
Get container name and status:
docker inspect -f 'Name: {{.Name}} | Status: {{.State.Status}} | IP: {{range .NetworkSettings.Networks}}{{.IPAddress}}{{end}}' debug-container
Output:
Name: /debug-container | Status: running | IP: 172.17.0.2
Pro Tip: Format strings are perfect for shell scripts:
# Get IP and save to variable
CONTAINER_IP=$(docker inspect -f '{{range .NetworkSettings.Networks}}{{.IPAddress}}{{end}}' debug-container)
echo "Container IP: $CONTAINER_IP"
Practical Inspection Examples
Check if Container Was OOM Killed
docker inspect -f '{{.State.OOMKilled}}' debug-container
Output:
false
If true, the container was killed due to Out Of Memory condition.
View Environment Variables
docker inspect -f '{{range .Config.Env}}{{println .}}{{end}}' debug-container
Output:
PATH=/usr/local/bin:/usr/local/sbin:/usr/local/bin:/usr/sbin:/usr/bin:/sbin:/bin
LANG=C.UTF-8
GPG_KEY=E3FF2839C048B25C084DEBE9B26995E310250568
PYTHON_VERSION=3.9.24
PYTHON_SHA256=668391afabd5083faafa4543753d190f82f33ce6ba22d6e9ac728b43644b278a
Get Container Start Time
docker inspect -f '{{.State.StartedAt}}' debug-container
Output:
2025-10-15T10:25:35.355155179Z
Best Practices for Docker Container Debugging
Log Management Best Practices
-
Use Structured Logging
- Log in JSON format for easier parsing
- Include timestamps, severity levels, and context
- Use consistent log formats across services
-
Set Log Rotation
- Prevent logs from filling up disk space
- Configure Docker's logging driver with max-size and max-file:
docker run -d --log-opt max-size=10m --log-opt max-file=3 myapp -
Centralize Logs
- Send logs to centralized logging systems (ELK, Splunk, CloudWatch)
- Use Docker logging drivers (json-file, syslog, fluentd, etc.)
-
Filter Effectively
- Use
--sinceand--tailto reduce noise - Combine with grep for specific error patterns
- Create shell aliases for common log queries
- Use
Interactive Debugging Best Practices
-
Non-Destructive Debugging
- Use
docker execinstead of modifying running containers - Don't install permanent debugging tools in production images
- Document any changes made during debugging sessions
- Use
-
Minimal Tool Installation
- Only install tools you actually need
- Remove debugging tools after investigation
- Consider creating a debugging sidecar container
-
Security Considerations
- Don't exec into production containers as root unless necessary
- Be cautious with
straceand similar tools (performance impact) - Avoid exposing sensitive data in logs
-
Exit Properly
- Always
exitfrom interactive shells cleanly - Understand the difference between
docker exec(creates new process) anddocker attach(attaches to main process)
- Always
Inspection Best Practices
-
Script-Friendly Output
- Use
-fformat strings for automation - Pipe to
jqfor complex JSON queries - Save frequently used format templates
- Use
-
Network Debugging
- Always inspect NetworkSettings for connectivity issues
- Verify port mappings match expectations
- Check both IPv4 and IPv6 configurations
-
State Verification
- Check OOMKilled status for memory issues
- Verify ExitCode for crash analysis
- Monitor StartedAt and FinishedAt timestamps
Command Cheat Sheet
Docker Logs Commands
| Command | Purpose |
|---|---|
docker logs CONTAINER | View all logs |
docker logs -f CONTAINER | Follow logs in real-time |
docker logs -t CONTAINER | Show Docker timestamps |
docker logs --tail N CONTAINER | Show last N lines |
docker logs --since 5m CONTAINER | Logs from last 5 minutes |
docker logs --since "2025-10-15T10:00:00" CONTAINER | Logs since timestamp |
docker logs CONTAINER 2>&1 | grep ERROR | Filter for errors |
docker logs --tail 50 -f CONTAINER | Last 50 lines + follow |
Docker Exec Commands
| Command | Purpose |
|---|---|
docker exec CONTAINER COMMAND | Run command in container |
docker exec -it CONTAINER bash | Interactive shell |
docker exec CONTAINER ps aux | View processes |
docker exec CONTAINER df -h | Check disk usage |
docker exec CONTAINER free -h | Check memory usage |
docker exec CONTAINER ip addr show | View network interfaces |
docker exec CONTAINER cat /path/to/file | Read file contents |
Docker Inspect Commands
| Command | Purpose |
|---|---|
docker inspect CONTAINER | Full JSON output |
docker inspect CONTAINER | grep -A 20 "NetworkSettings" | Network settings |
docker inspect -f '{{range .NetworkSettings.Networks}}{{.IPAddress}}{{end}}' CONTAINER | Get IP address |
docker inspect -f '{{.State.Status}}' CONTAINER | Get container status |
docker inspect -f '{{.State.OOMKilled}}' CONTAINER | Check if OOM killed |
docker inspect -f '{{range .Config.Env}}{{println .}}{{end}}' CONTAINER | List environment variables |
Common Debugging Tools to Install
| Package | Installation Command | Provides |
|---|---|---|
| procps | apt-get install -y procps | ps, top, free, vmstat |
| iproute2 | apt-get install -y iproute2 | ip, ss, bridge |
| curl | apt-get install -y curl | HTTP client |
| htop | apt-get install -y htop | Interactive process viewer |
| strace | apt-get install -y strace | System call tracer |
Summary
In this first part of the Docker debugging series, you've mastered three fundamental debugging tools:
✅ docker logs: View, follow, filter, and analyze container logs in real-time ✅ docker exec: Execute commands and access interactive shells inside running containers ✅ docker inspect: Extract detailed container configuration and network information
Key Takeaways:
- Always start with
docker logsto understand what the application is reporting - Use
docker exec -itfor interactive debugging when logs aren't sufficient - Leverage
docker inspectwith format strings for automation and scripting - Install debugging tools temporarily, don't bake them into production images
- Combine Docker commands with standard Linux tools (grep, jq) for powerful debugging workflows
What's Next?
In Part 2, we'll explore advanced debugging techniques:
- docker attach: Connect directly to container's main process
- Container Networking: Debug inter-container communication and network isolation
- Resource Management: Monitor and troubleshoot CPU, memory limits with docker stats
- Build Debugging: Diagnose Dockerfile and build failures
- System Maintenance: Clean up with container and image pruning
Master Docker debugging to build resilient, production-ready containerized applications!